Data analytics has become an integral part of the audit process. And where a few years ago it was an area where we were exploring and creating tactical solutions to problems, today the NAO, like many organisations, has developed a strong capability and is making significant progress towards the widespread adoption of data analytics across all elements of our audit work.
Data analytics helps auditors in three ways:
- Increasing productivity: driving efficiencies through automation, especially in relation to handling large volumes of data
- Adding insight: creating new insights through linking together data and mining for patterns and anomalies
- Improving quality: improving consistency and avoiding errors, and enabling tests to be performed on large or complex data sets where a manual approach would not be feasible
At the NAO, we use a wide range of technologies and techniques in our data analytics work. These can be grouped into three core areas: data curation and warehousing; analysis in audit; and data visualisation.
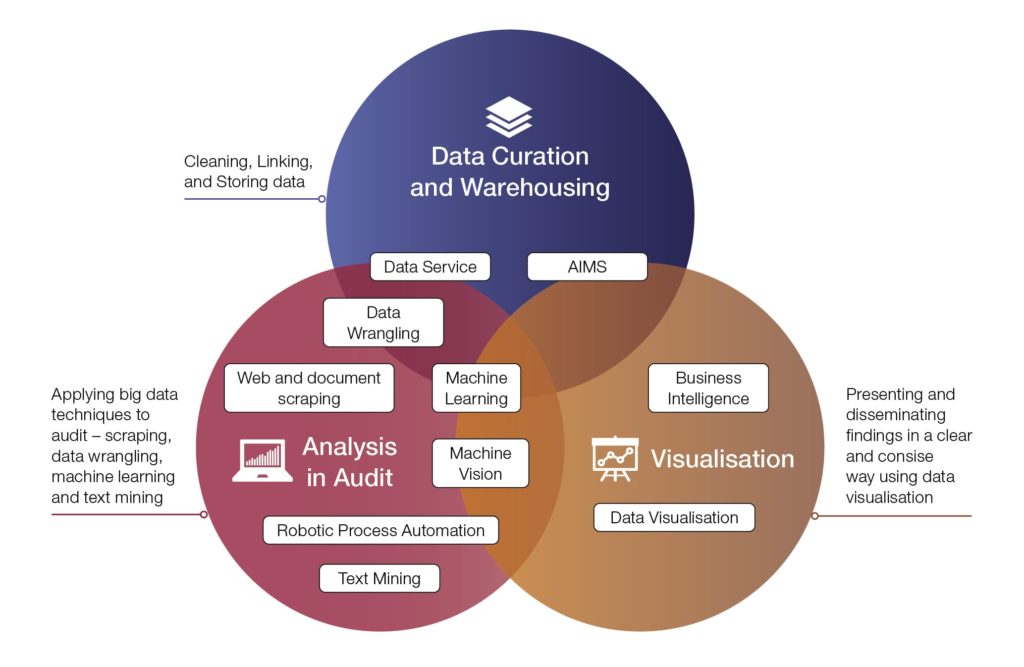
Data curation and warehousing: the foundation of everything we do
Accessing and handling large amounts of data is a pain point for any auditor. We’ve built an in-house NAO data service that holds a wide range of government statistical and administrative data sets, cleaned, linked, and easily accessible through a bespoke app. Our data service saves time that auditors can instead spend on analysis and interpretation rather than data wrangling, and reduces the risks associated with data cleaning.
Where our auditors do need to process and manipulate large quantities of data, we use code-based data wrangling approaches that allow us to analyse larger datasets than previously possible.
On the financial audit side, our cloud-based Audit Information Management Service provides a secure system for storing client data in one consistent, easily-analysed space. We are in the process of automating the upload, cleaning and preparation of client data. When it is fully rolled out, the platform will enable greater automation of financial audit processes, and give us opportunities for deeper client understanding and insights.
Visualisations unlock the analytical power of the human mind
Visualising data helps unlock the natural analytical power of the human brain. An interactive visualisation that can be explored is a platform for the real-time generation and testing of hypotheses.
We use visualisations to provide us with business intelligence on clients and to help us assess audit risk. Analytics on business processes such as payroll and procurement give us new perspectives, and help us to identify outliers or anomalies. For example, payroll analysis at one client revealed an unusual concentration of manual payroll payments in September, which we were then prompted to explore further.

Using data visualisation in the audit process helps in other ways.
When we audited army recruitment in 2018, we looked at how journey times to recruitment centres had been impacted by the decision to close a number of recruitment offices.
Mapping the increase in journey times helped our auditors to identify hypotheses which could be explored further, such as the relationship between closing centres and recruitment.
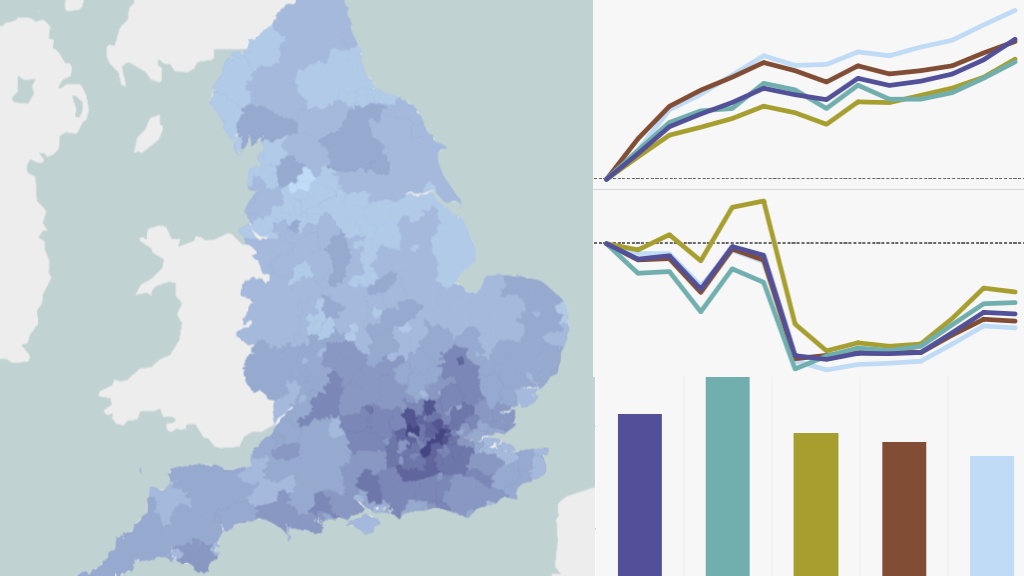
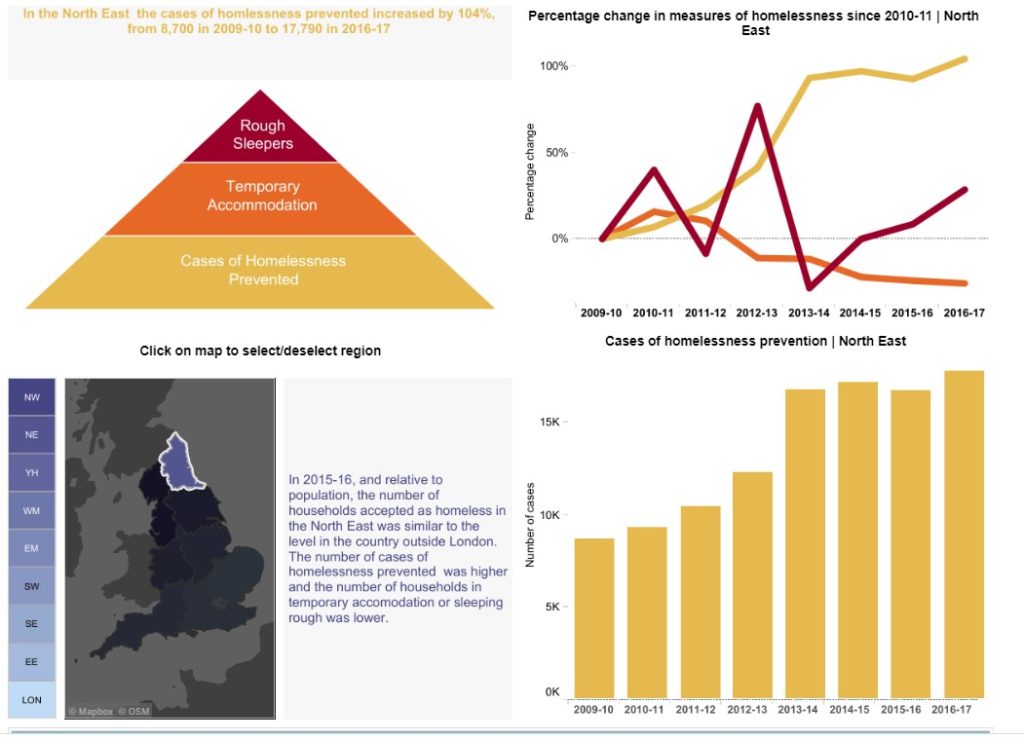
And once a value for money report or investigation is published, data visualisations give clients and other stakeholders another way to understand the findings. These interactive data visualisations can be found on our website, where anyone can explore the findings from a range of our audits, from homelessness in England to the closure of courts and tribunals across the country.
Analysis as part of the audit process
Generating hypotheses from data is one way that analytics supports audit. But there are many others.
For some audits, we have scraped the websites of audited bodies to extract data or text in an automated way. This allows us to access the latest data and published reports, and means we can make a more in-depth assessment by looking at all of the data, instead of just taking a sample because we are constrained by the difficulty of assembling data.
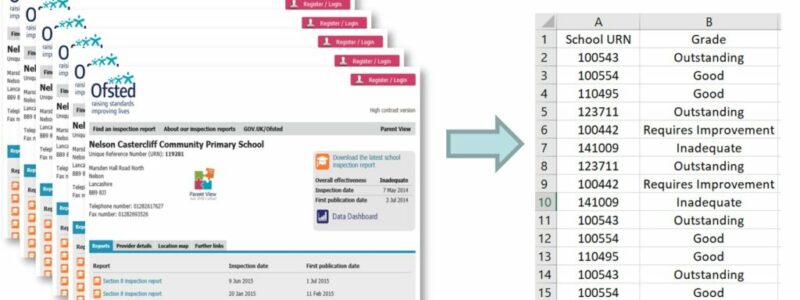
So when we looked at pupil premium funding in schools, we were able to automatically scrape text from over 7000 Ofsted inspection reports relating to the effectiveness of pupil premium funding in each school, along with the school’s inspection rating.
We also scrape text from documents and use text mining methods such as sentiment analysis to derive insight from it. That can speed up our audits in a number of ways – from helping us pull together and summarise information on a topic from our own back catalogue to quickly identifying year-on-year changes to accounting policy notes.
Machine learning and process automation
Some problems take more than a simple software script to unlock. Machine learning can be used to look for hidden patterns in data, such as grouping transactions into clusters in order to identify potential anomalies.
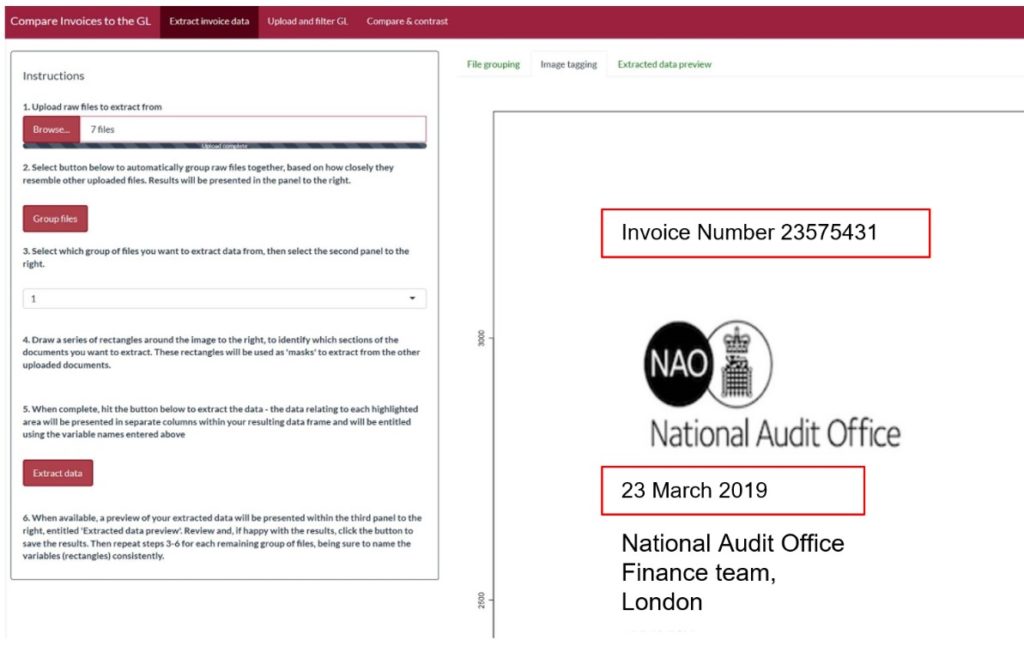
For example, we are developing an approach to extracting data from large numbers of invoices. These invoices aren’t usually identical – but many share common layouts.
We have developed a prototype app to cluster these invoices into just a handful of layouts from which a person could pick out particular data of interest, such as a date, or an organisation name, and teach the app to pull the same type of information from tens of thousands of documents.
A skillset all auditors should develop
With data analysis becoming increasingly central to audit, coding training is now provided as standard to all our trainees and analysts. We are building up our specialist capability to support the development of new (often self-serve) tools, but all auditors will need an ability to use the tools we develop, and enough basic data literacy to discuss and understand client data structures.
In time, we’d like to open up our internal tools and services for others to both use and also build on. As well as providing greater public value for what we’ve developed, this is a journey that we’d like to share, to discuss our experiences and make connections with others who doing similar work.
Over time, we believe data analytics will continue to transform our audit work, supporting higher quality and more efficient audits, and creating and communicating new insights that cannot be achieved in other ways.
Author
Ruth Kelly

Ruth is our Chief Analyst and leads the Analysis Insights team. She has wide experience of applying economics and other analytical approaches to support policy evaluation, investment decisions and risk management.
Prior to joining the NAO, Ruth held business evaluation and risk management roles for a global resources company, and advised clients on carbon and energy issues for an economic consultancy practice.