
James Gjertsen explains how the NAO uses spatial analytics to bring audit teams closer to the data and visualise the complex geographic relationships at work behind the scenes in the justice system
From public transport to healthcare, we use services and infrastructure provided by central and local government all the time. Multiple Government departments have to coordinate long term decisions about provision of services and land use – and these all come together in a place. Bringing a place-based focus to decisions is key to maximising the positive impact government can have on our lives. This is why the NAO has an increasing interest in the power of spatial analysis to provide insight.
Even within a single policy area, such as health or justice, one department or ministry can be responsible for managing multiple different types of organisations that need to work together to deliver a coordinated service for users. One area we recently looked at was the criminal justice system.
This involves a range of organisations, from police forces to courts and probation. Mapping the spatial relationships between these organisations helps us answer deeper questions about the co-ordination and delivery of those services. We can ask more insightful questions about where backlogs are occurring or how the user experiences their linked-up journey through the system, and spot good practice. But all this starts with how these organisations relate to one another spatially.
To explore this, we developed an interactive tool visualising how all these various organisations interact with each other. You can use it to see at a glance where those interactions are simple and where they may be more complicated, along with summaries for each body.
This quickly shows that the number of organisations interacting with each other can add up fast: for police forces the Metropolitan Police tops the list for the most interactions with 63 local interacting organisations! This includes one prison region, HM Courts and Tribunals Service cluster and youth Justice Board, two Crown Prosecution regions, nine local justice areas, eighteen Probation Delivery Units and thirty-one Youth offending teams.
The tool can help raise questions about the efficiency of the criminal justice system by providing geographic context around the interactions between the various bodies.
Under the hood
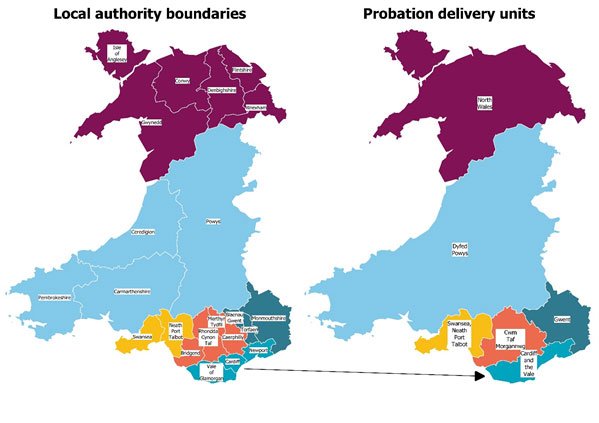
The tool uses local authority boundaries as the building blocks for each organisation’s map layer. As an example: For probation delivery units, Cardiff, Newport and the Vale of Glamorgan are listed under the same unit, “Cardiff and the Vale”. The tool joins these local authorities’ boundaries together to produce a boundary that represents the probation delivery unit.
There were benefits to using this approach. Firstly, a few of the organisations didn’t have a set of predetermined boundaries to provide us, so using this approach let us construct them from scratch.
Secondly, using the same building blocks for each layer makes comparing them much easier. Boundaries will often be simplified to shrink the size of files being dealt with. Imagine trying to record the borders of a town. If you took measurements every 500 meters you would need far fewer measurements than if you took them every ten centimetres, and for some purposes the result would be just as useful.
However, it can be hard to compare boundaries that may have been recorded differently. Using the same base boundaries to build all the layers simplifies things. They will all be recorded in the same way and any differences that get flagged will be genuine, no extra work needed.
We’ve been building our capacity at the NAO to use data and spatial analytics to derive deeper insights around the topics we audit. This tool is just one of the ways we are supporting our current and future work by bringing teams closer to the data, by clearly articulating the complex geographic relationships at work behind the scenes. Why not see for yourself?
Author
James Gjersten

James is a Senior Analyst in the Analysis Hub at the NAO. He joined the NAO in 2018 and leads the Analytical Insights Team which aims to support the NAO’s VFM work programme by drawing deeper insights from the data it collects.