At the NAO, our central analysis team supports value for money studies by applying specialist analysis techniques to government data in order to generate new insights. For our Investigation into the Windrush Compensation Scheme, we used process mining to help the study team understand the Home Office’s operation of the scheme.
Process mining is an exciting technique that allows you to gain a detailed understanding of a process purely by analysing data that users of the process generate, which can be found in automated event logs. It allows us to understand the flow of cases through a system, including the time taken for different activities, how resources are used and where bottlenecks occur, and as such can be vital in assessing the performance of the overall process.
To use process mining, the minimum data requirement is an event log containing Identification Codes (IDs) that are unique to each case, consistent labels relating to actions made on a case, and a timestamp for each action. For our work on the Windrush Compensation Scheme, we analysed logs generated by the Home Office’s case management system for dealing with compensation claims using the open source programming language R, specifically the bupaR collection of packages.
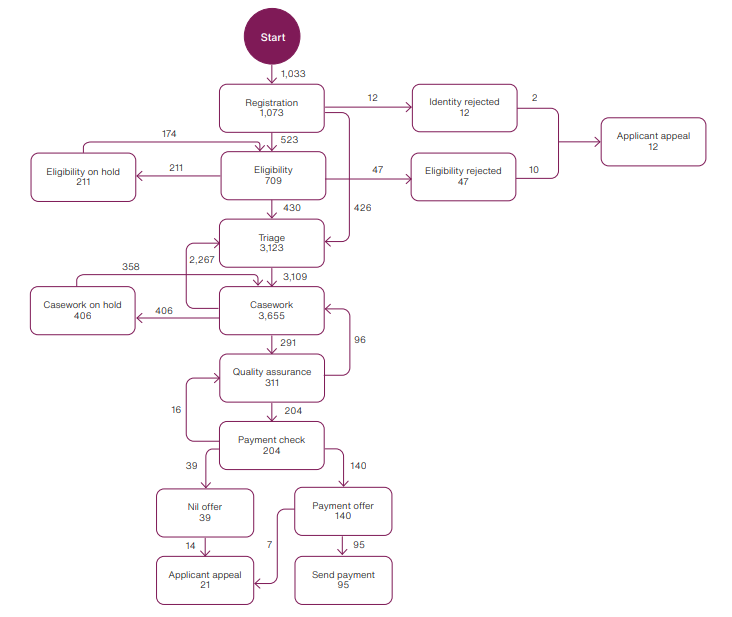
Our first step using process mining was to create a process map. This output provided a powerful visual representation of the different stages of the case management system and the way in which cases move between stages – beginning with registration and ending ultimately in either claim payment or rejection.
A simplified version of the process map was included in the report and is repeated below. The different nodes shown here represent the different stages in the process, while the numbers show how many times a compensation scheme case has entered/re-entered a stage (boxes), or, the number of times cases have moved between stages (connecting lines).
Next, we used process mining to create an animated version of the process map. This showed all individual compensation scheme cases dynamically moving through the system between stages. It proved very effective in illuminating the rate at which cases progress through the system and the stages where that progress is slower – A short illustrative GIF of this output is shown below (see also footnote 2).
Visualising the Windrush Compensation Scheme in these ways enabled the study team to better understand its operation and to draw out insights from the client’s case management systems. As a result, our auditors were able to define complex hypotheses and explore these with the client, using process mining analysis to support their findings.
For example, our analysis showed that, of cases that were subject to a quality assurance check, half needed to return to a caseworker, indicating a significant level of rework. We were able to use process mining to combine this with observed data and quantify the exact rate at which this occurred. In another example, our study team were able to use process mining to compare the Department’s initial estimates for the average number of hours to do everything required on a case, end to end, with the actual number of hours recorded in the Department’s data for cases up to 31 March 2021.
Using advanced analytics – in this case process mining – our study team enhanced their understanding of the Windrush Compensation Scheme and the report’s findings.
You can read more about the Investigation here: Windrush Compensation Scheme, and if you are interested in knowing more about Analysis at the NAO, visit our Analysis page on the main NAO site.
Authors: Mohit Motwani and Ben Coleman
Ben and Mohit work in the NAO’s analysis hub, helping support value for money studies by providing complex data analysis techniques to study teams. They both undertook process mining work in relation to the NAO’s Investigation into the Windrush Compensation Scheme.
Footnotes
Note 1
- Data relate to 1033 cases for which a registration stage was created after 13 March 2020 and show the observed movement of these cases through the system until the 31 March 2021.
- The numbers shown are a count of instances of cases reaching a stage or moving between stages, rather than a count of the number of unique cases. Some intermediate stages such as offer and payment approvals and payment preparation have been omitted for clarity.
- Some movements between stages have also been omitted for clarity, including:
- Cases moving back following successful applicant appeal;
- Cases moving back to registration or eligibility following casework;
- Cases moving back to casework following payment offer.
Source: National Audit Office’s analysis of Home Office applications data
Note 2
The full version of this covered the period March 2020 to March 2021, which was the period for which we had access to full case management records in the event log.